Consider a transfer function with real poles and zeros:
This can be written in Bode form:
where is the DC gain,
Bode Plots

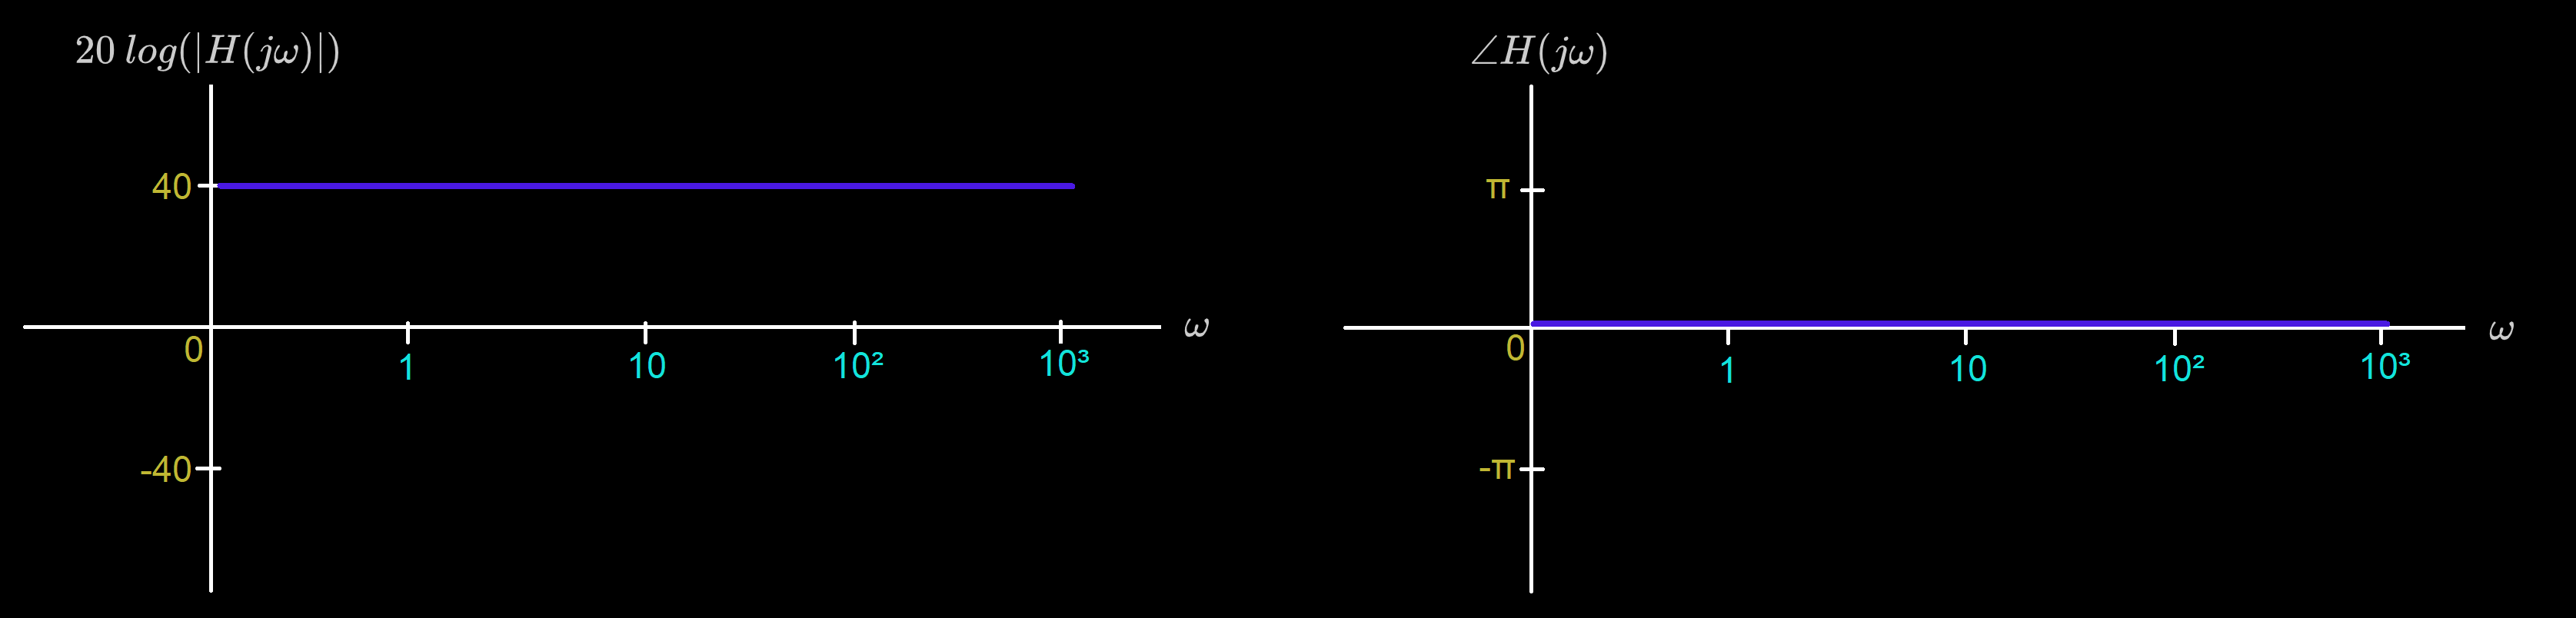
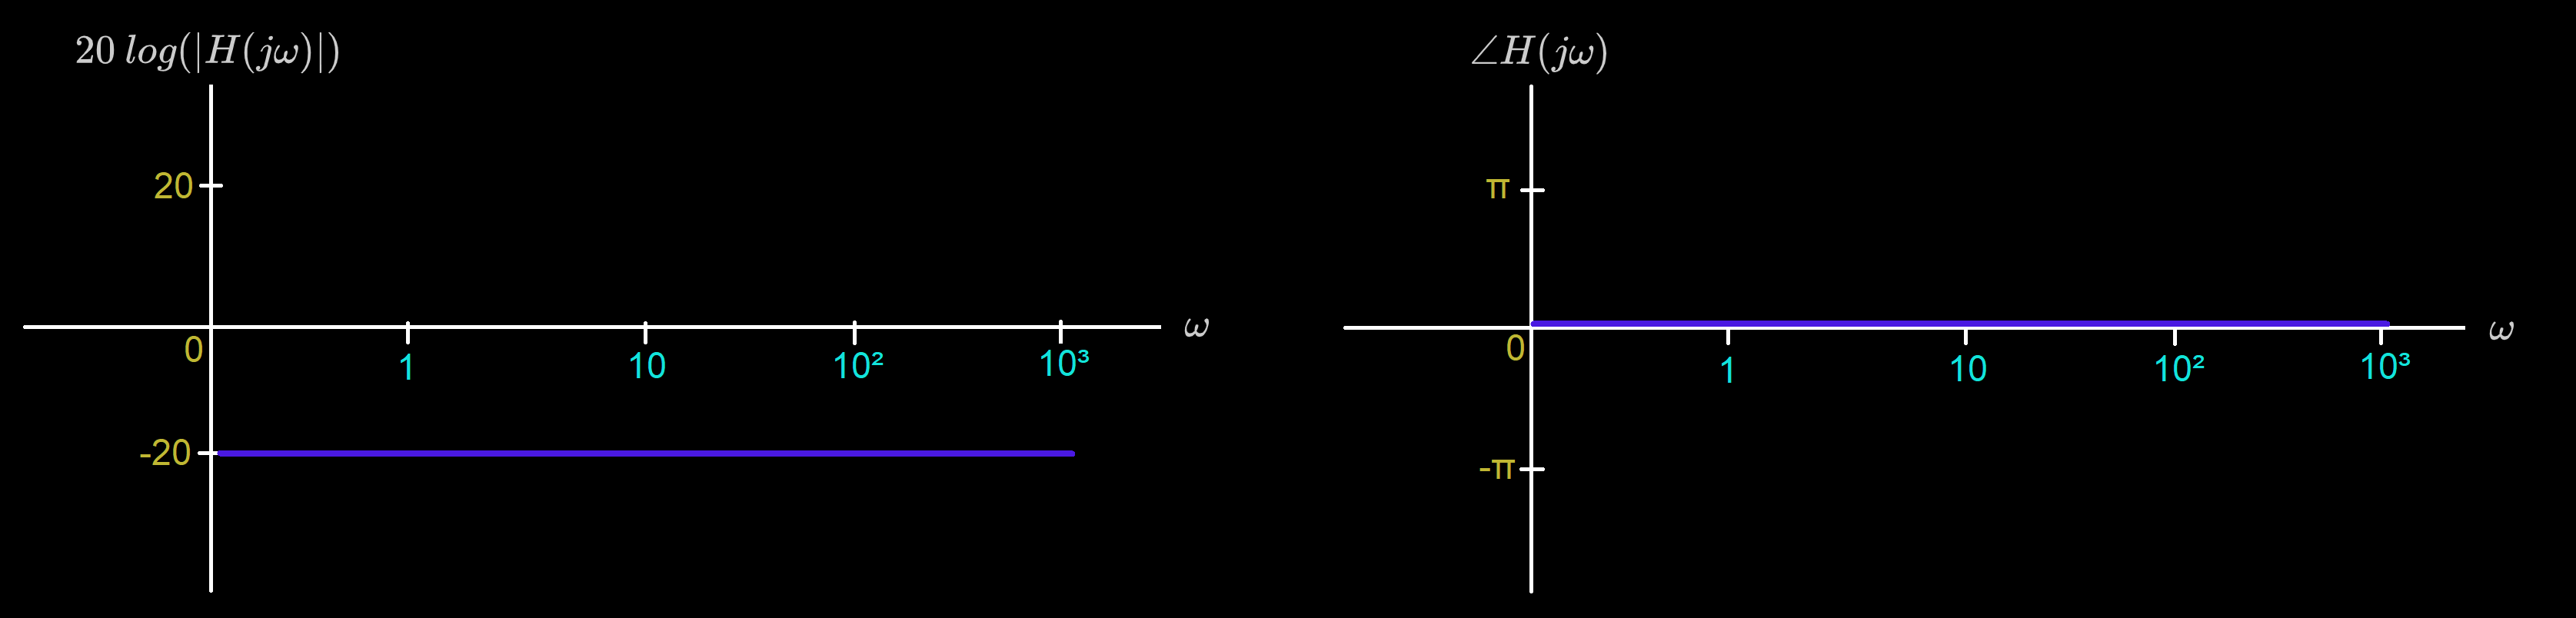
Constant
Let . Then,
Bode Plot for :
Bode Plot for :
Zeros & Poles At Origin
Let . Then,
Bode Plot for :
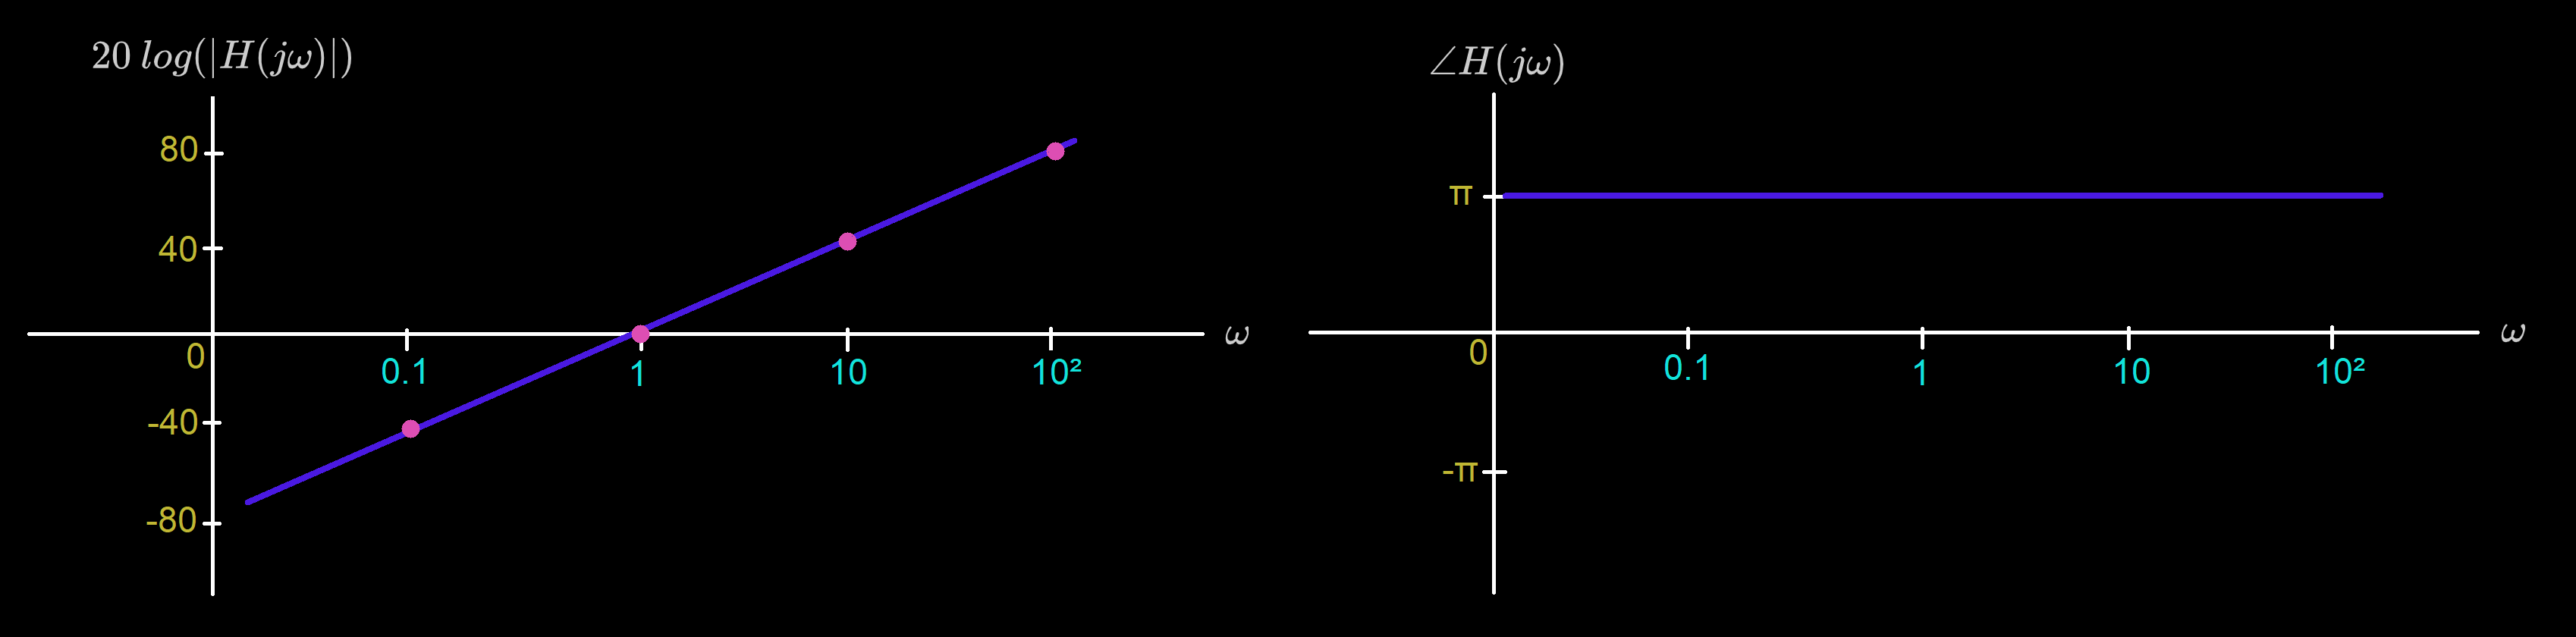
Bode Plot for :
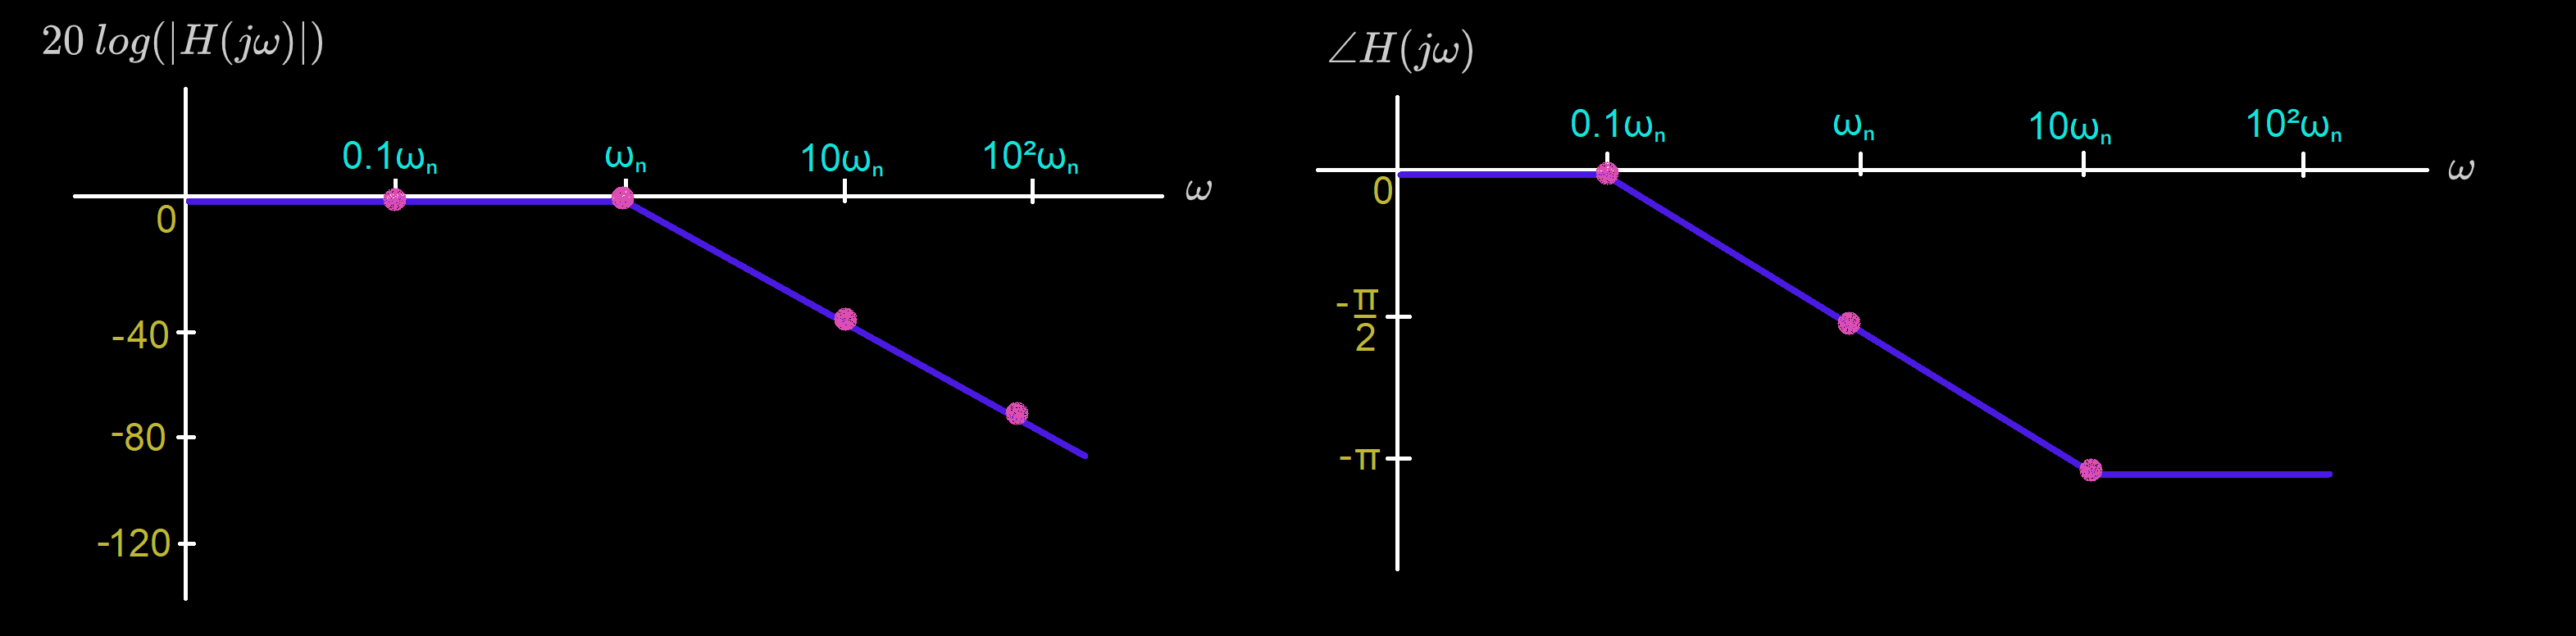
Real Zeros & Poles
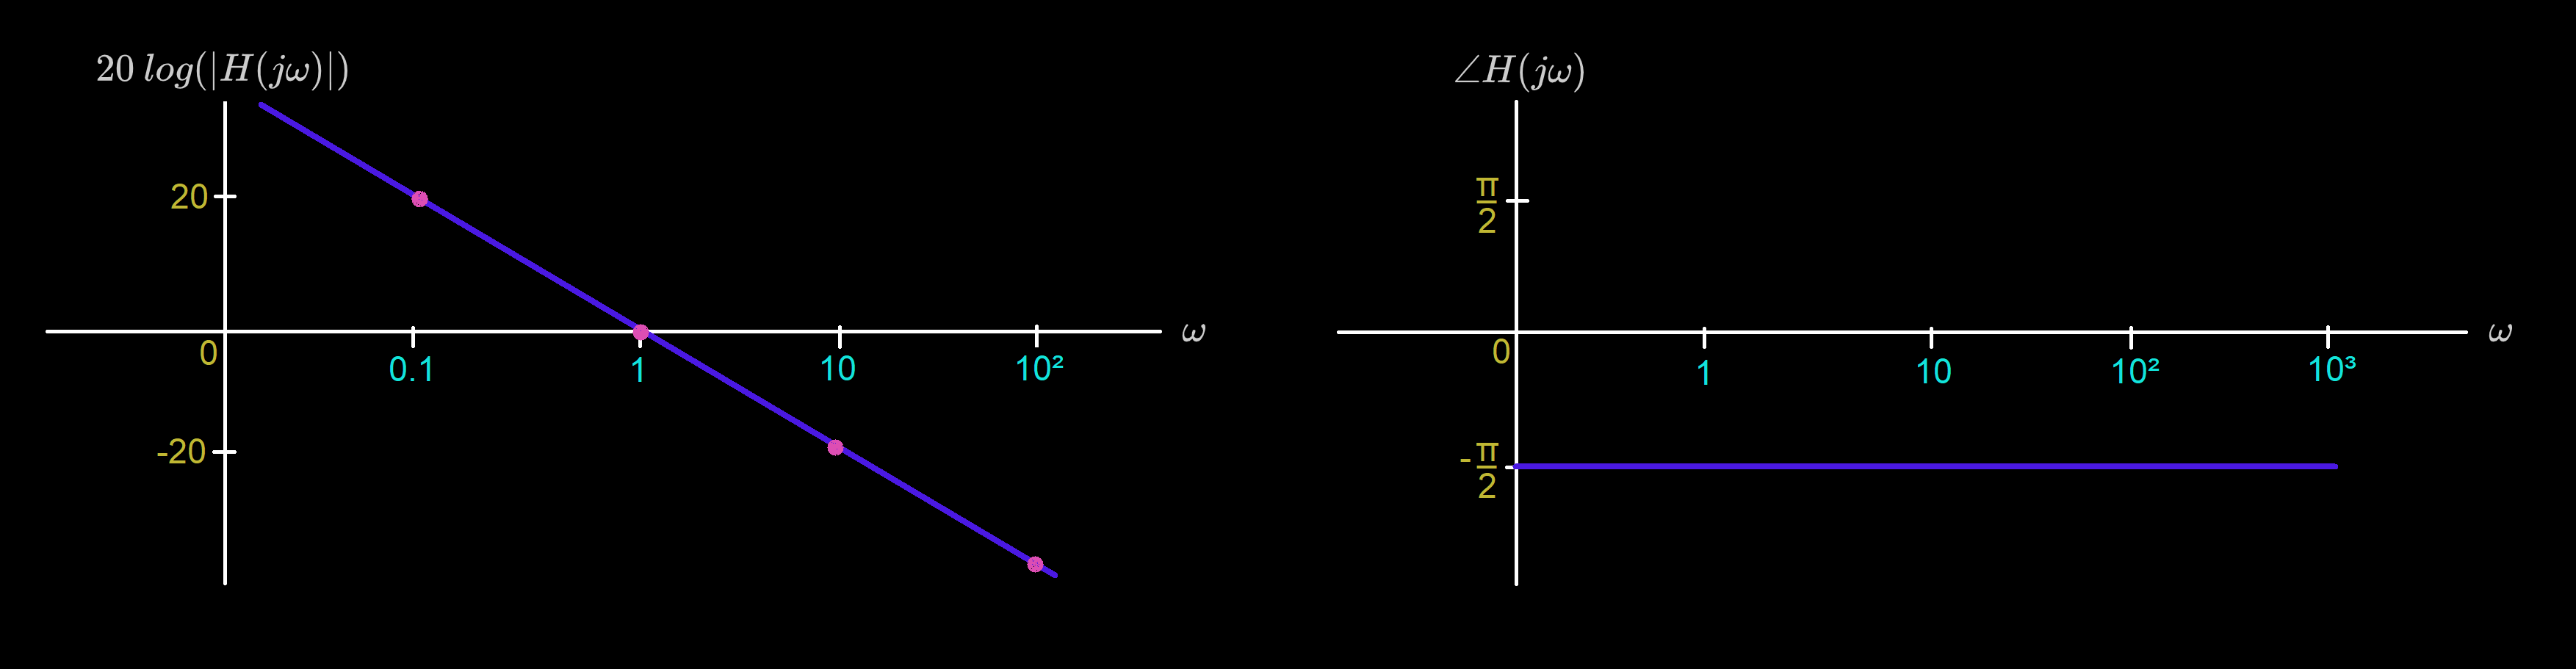
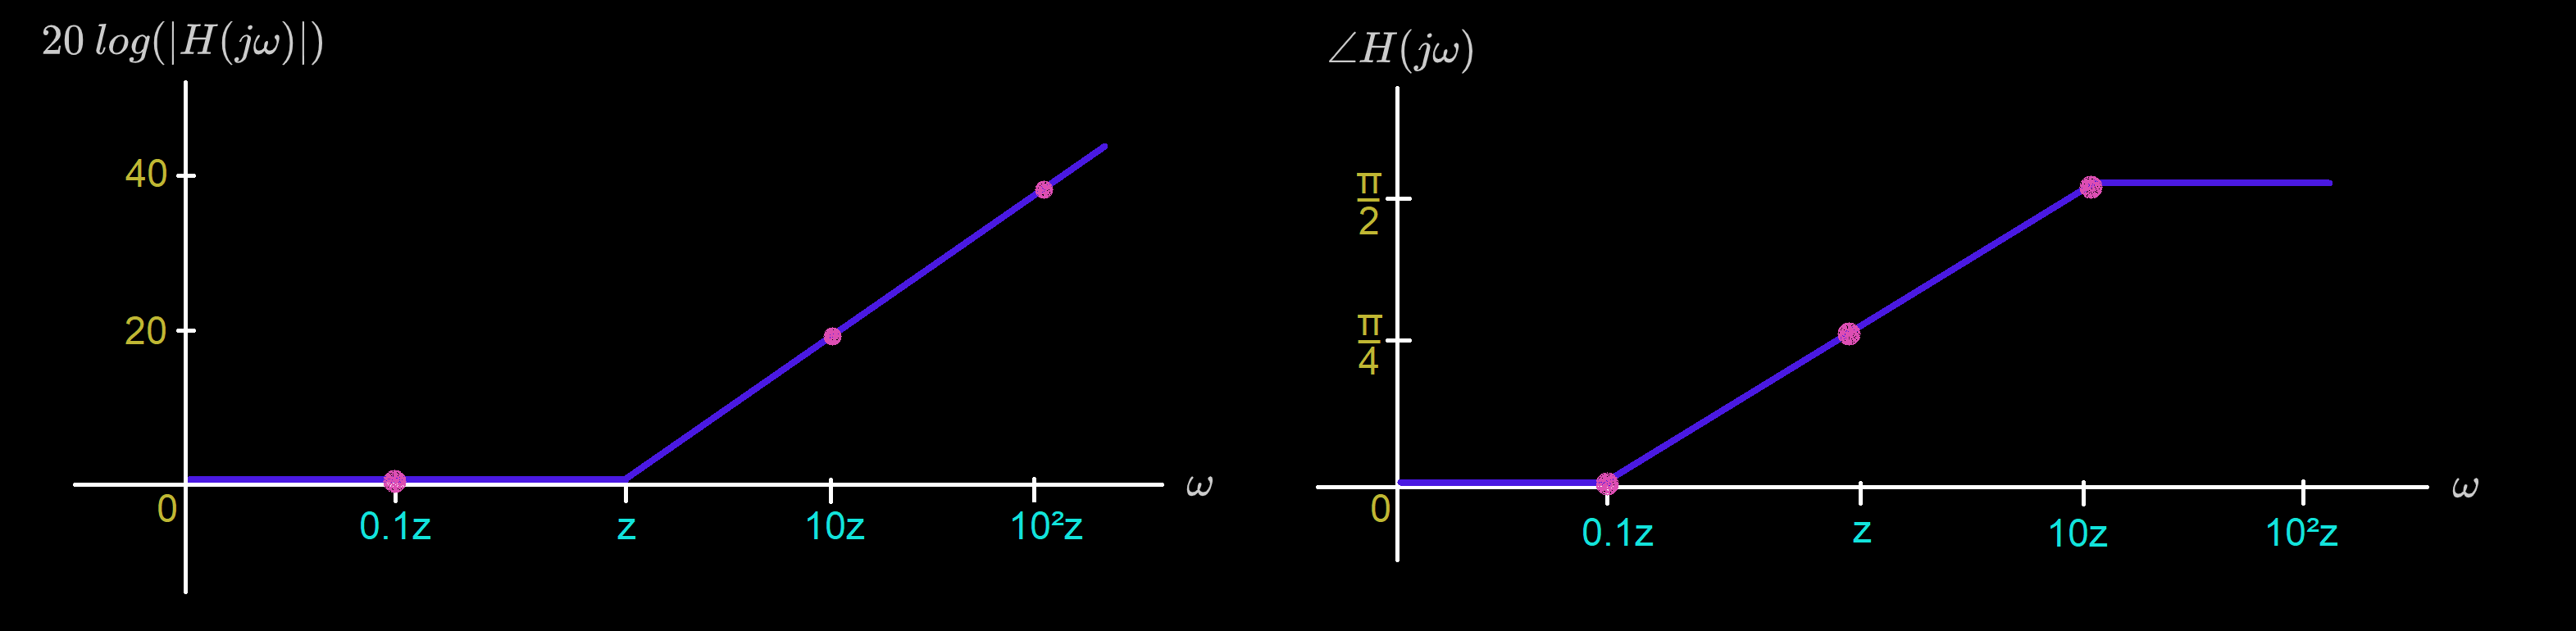
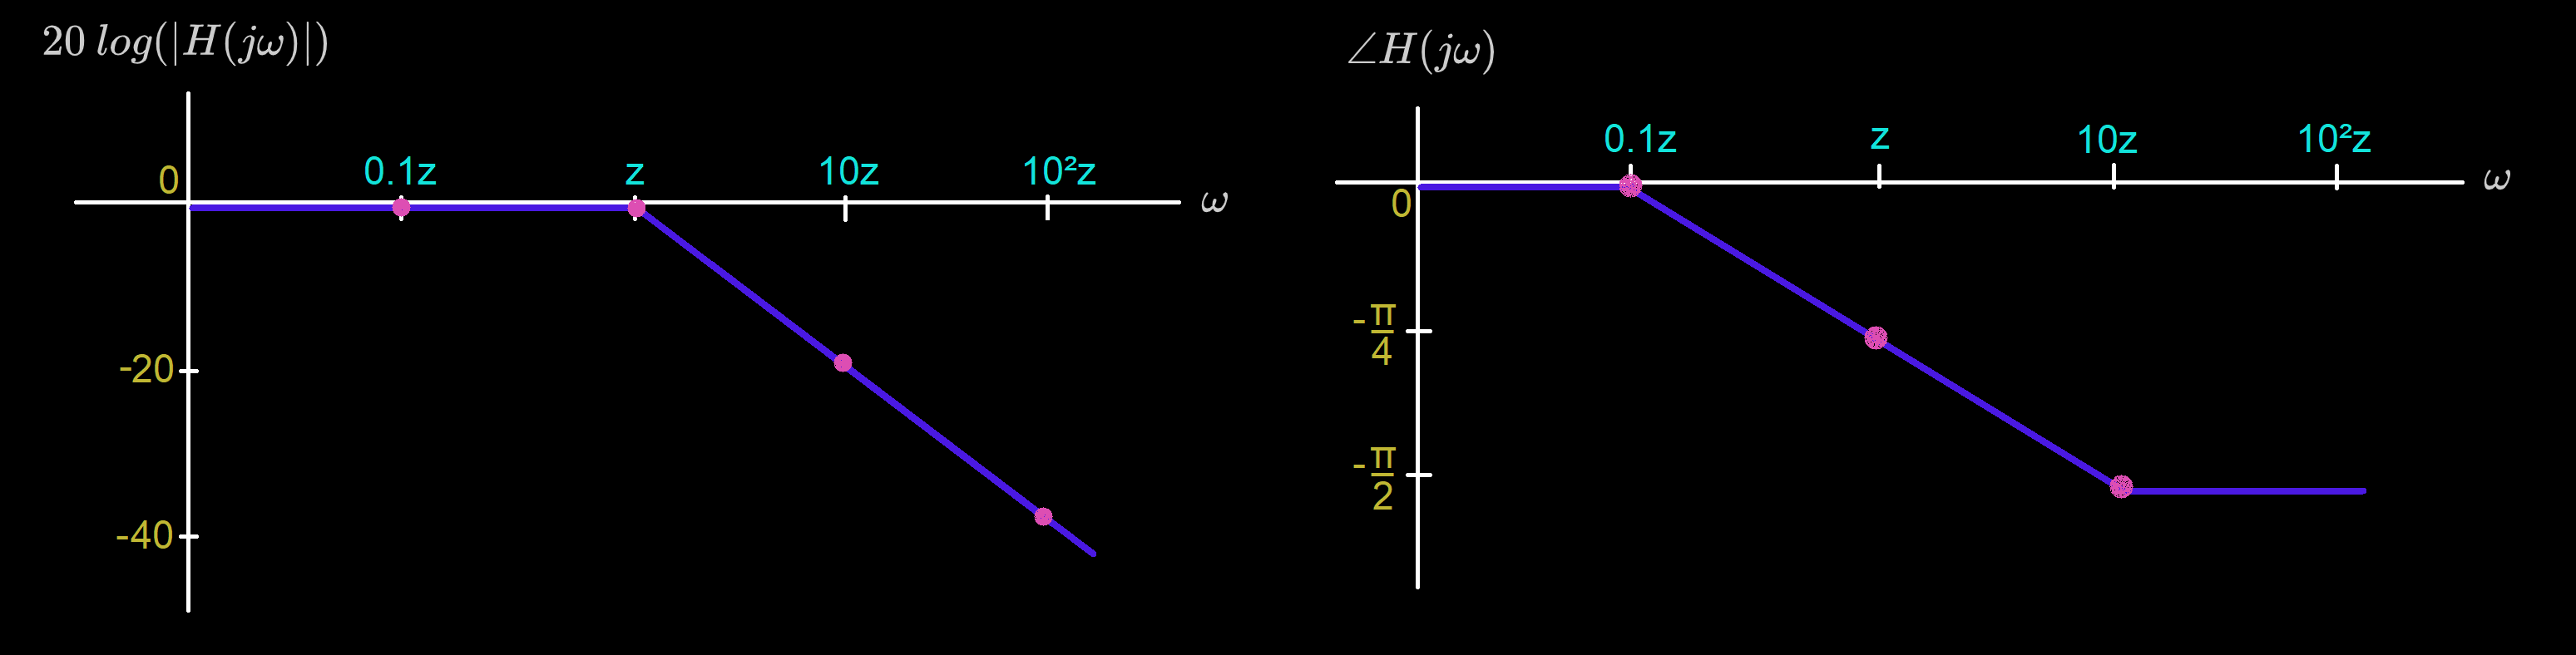
Let . Then,
For convenience, we draw the magnitude as a linear transition of slope dB/decade starting at .
For convenience, we draw the phase as a linear transition starting at and ending at .
Bode Plot for :
Bode Plot for :
Complex Zeros & Poles
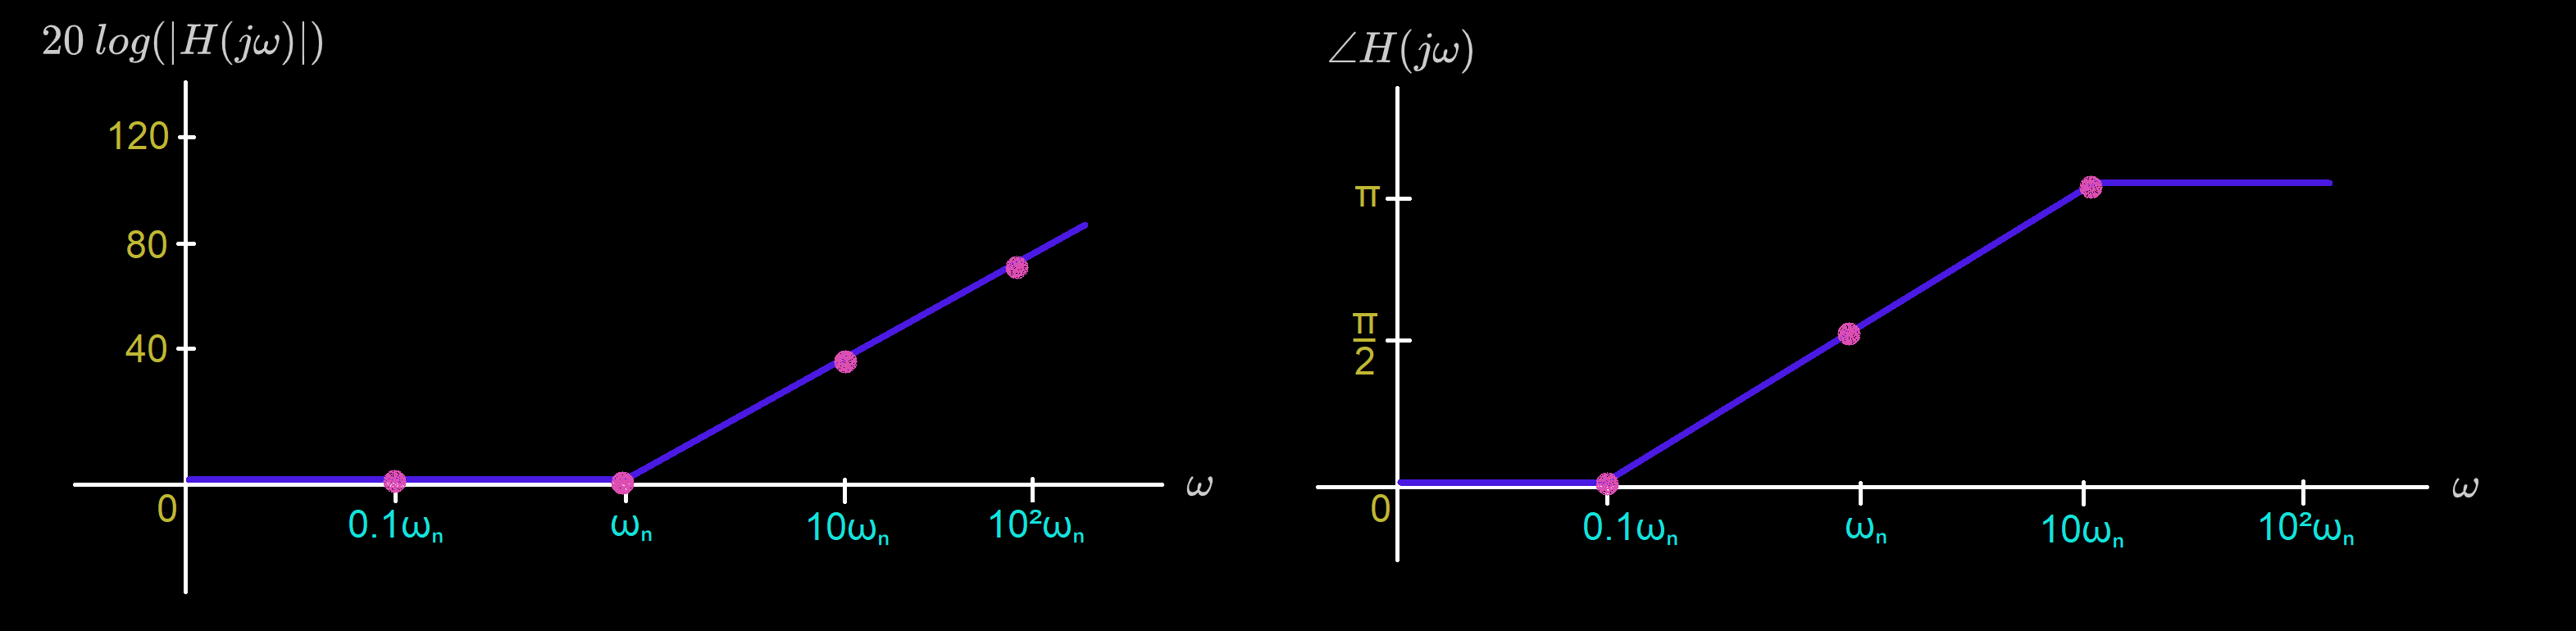
Let . Then,
For convenience, we draw the magnitude as a linear transition of slope dB/decade starting at .
Bode Plot for :
Bode Plot for :